
Description:
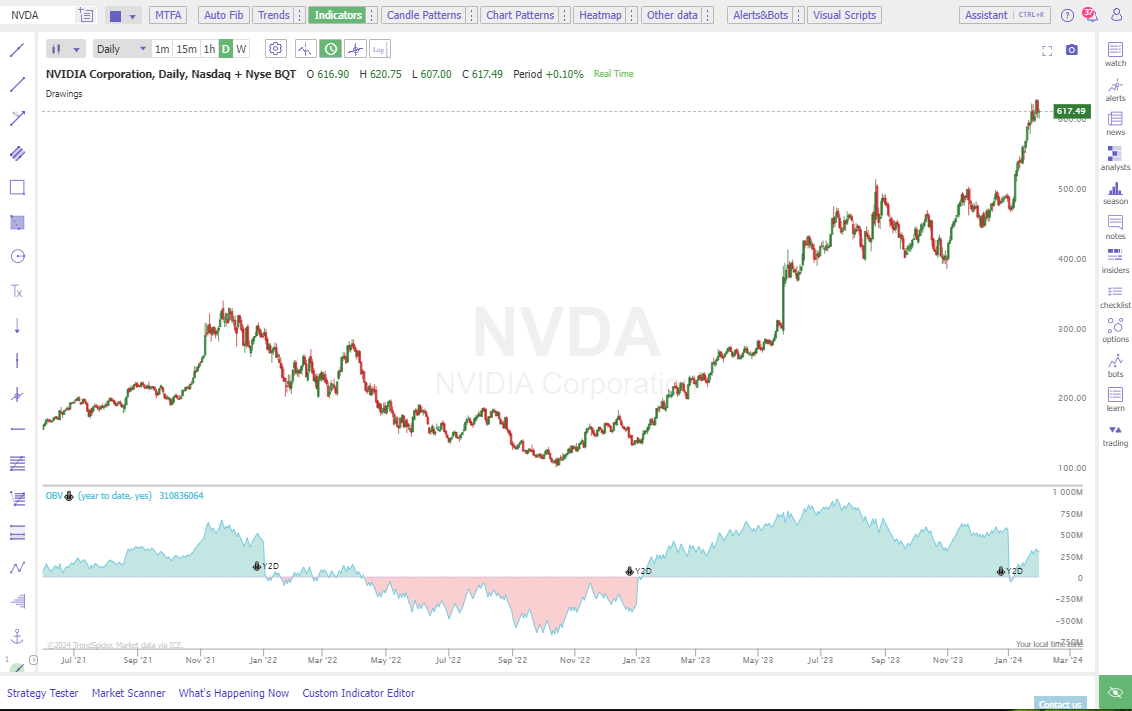
On-Balance Volume (OBV) anchored from a specific point, providing insight into volume changes relative to a significant event or date. OBV measures buying and selling pressure by adding or subtracting volume based on whether prices close higher or lower, providing insights into potential trend reversals or confirmations.
Input Parameters:
- Anchor To: Determines the location of where you will automatically anchor the starting point.
- Continuous: do you want the indicator to paint continuously on the chart or only the most recent anchor point
Use Cases:
- Identify potential trend reversals: When the OBV line diverges from the price trend, it could signal a possible trend reversal. For example, if the price is increasing, but the OBV line is declining, it might indicate that buying pressure is weakening, and the upward trend may soon reverse.
- Confirm price breakouts: A breakout occurs when the price moves outside a predefined support or resistance level. The OBV can be used to confirm these breakouts by ensuring that the volume supports the price movement.
- Evaluate the strength of a trend: A rising OBV line during an uptrend confirms the trend’s strength, suggesting that it may continue. Similarly, a falling OBV line during a downtrend indicates intense selling pressure, which could mean the downward trend will persist.
Do you want to learn more? Check out our Learning Center Article.
*
What went wrong? (Optional)