
Description:
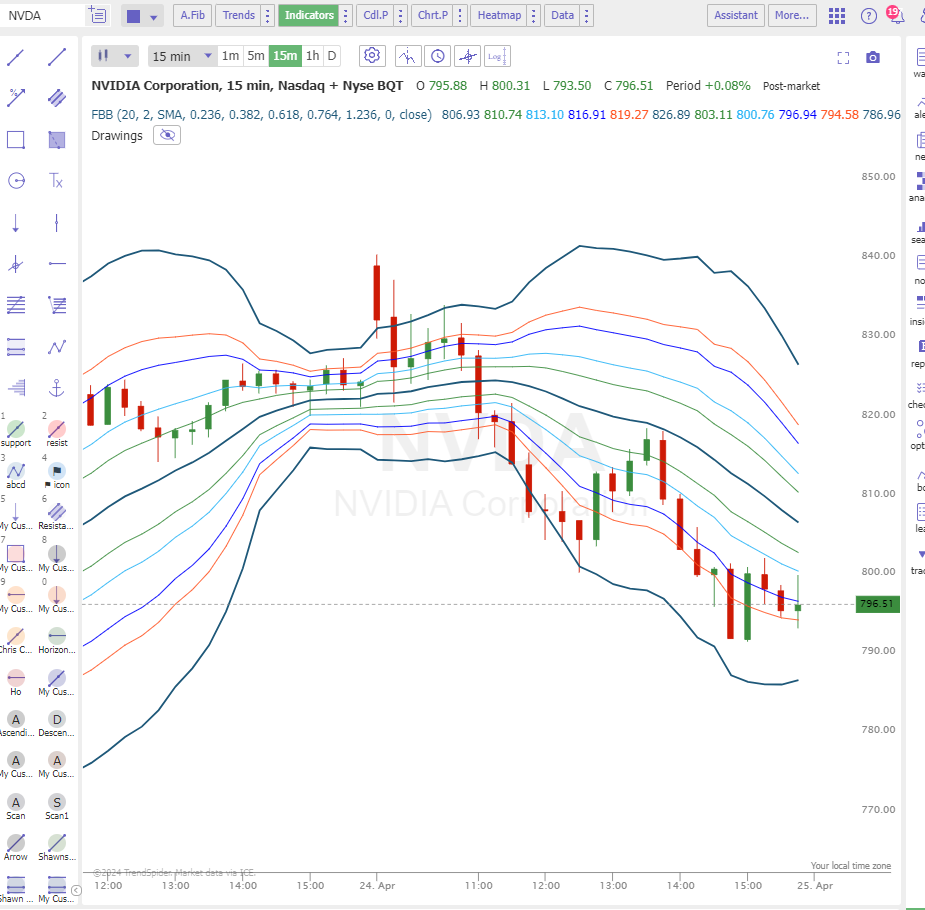
Fibonacci Bollinger Bands are a variation of the standard Bollinger Bands, incorporating Fibonacci ratios to set the band widths instead of the standard deviation. This method adjusts the distance of the bands from the central moving average based on Fibonacci levels, typically including 1.618, 2.618, and 4.236, which are believed to reflect more accurately market volatility and price dynamics.
Input Parameters:
- Length: Number of periods used in the calculation.
- Moving Average Select the moving average type such as EMA, SMA, or HullMA.
- Fibonacci Levels: Value used to determine the levels of the indicator, preset to typical Fibonacci levels.
Use Cases:
- Trend Identification: The position of price relative to the Fibonacci levels can indicate trend strength and direction.
- Volatility Analysis: Wider bands suggest increased market volatility, while narrower bands indicate less volatility.
- Trading Signals: Price interactions with the bands can signal potential buy or sell opportunities, similar to traditional Bollinger Bands. Breakouts above or below Fibonacci levels might suggest continuation or reversal.
This feature can be used in:
- Market Scanner
- Strategy Tester
- Dynamic Alerts
- Multi-Factor Alerts
- Smart Checklist
Do you want to learn more? Check out our Learning Center Article.
What went wrong? (Optional)