
Description:
The Triangular Moving Average (TMA) is a smoothed moving average that places a greater weight on the middle data points of the price series. It is the result of a double-smoothed simple average: first, the simple moving average (SMA) is calculated over a specified period; then, another SMA is applied to the result, effectively averaging the average. This process reduces market noise and lag compared to traditional moving averages, providing a clearer view of the trend direction.
Input Parameters:
- Length: number of periods used in calculation.
Use Case:
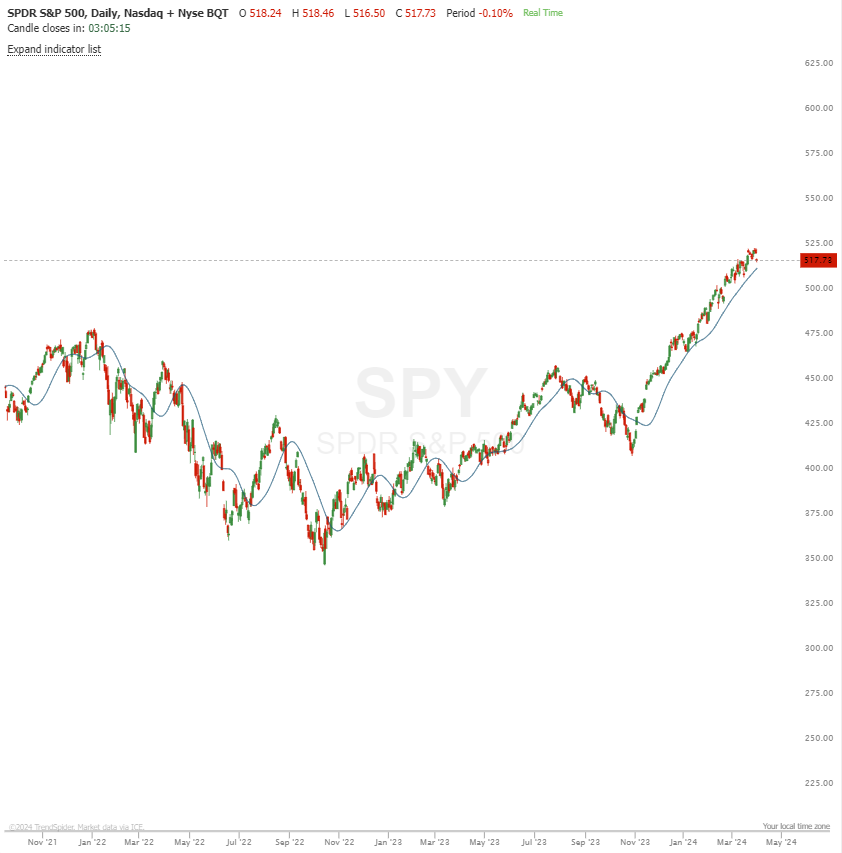
- Trend Identification: The position of the price relative to the TMA can indicate the market trend. Prices above the TMA suggest an uptrend, while prices below indicate a downtrend.
- Trend Reversals: Changes in the direction of the TMA can signal potential reversals. If the TMA starts to turn upwards after a downtrend, it might suggest a reversal to an uptrend, and vice versa.
- Support and Resistance Levels: Due to its smoothing effect, the TMA can act as dynamic support in uptrends and resistance in downtrends, helping traders identify potential entry and exit points.
- Crossovers: Similar to other moving averages, the crossover of a short-period TMA above a long-period TMA may signal a buying opportunity, while the opposite crossover could indicate a selling opportunity.
Do you want to learn more? Check out our Learning Center Article.
What went wrong? (Optional)