
Description:
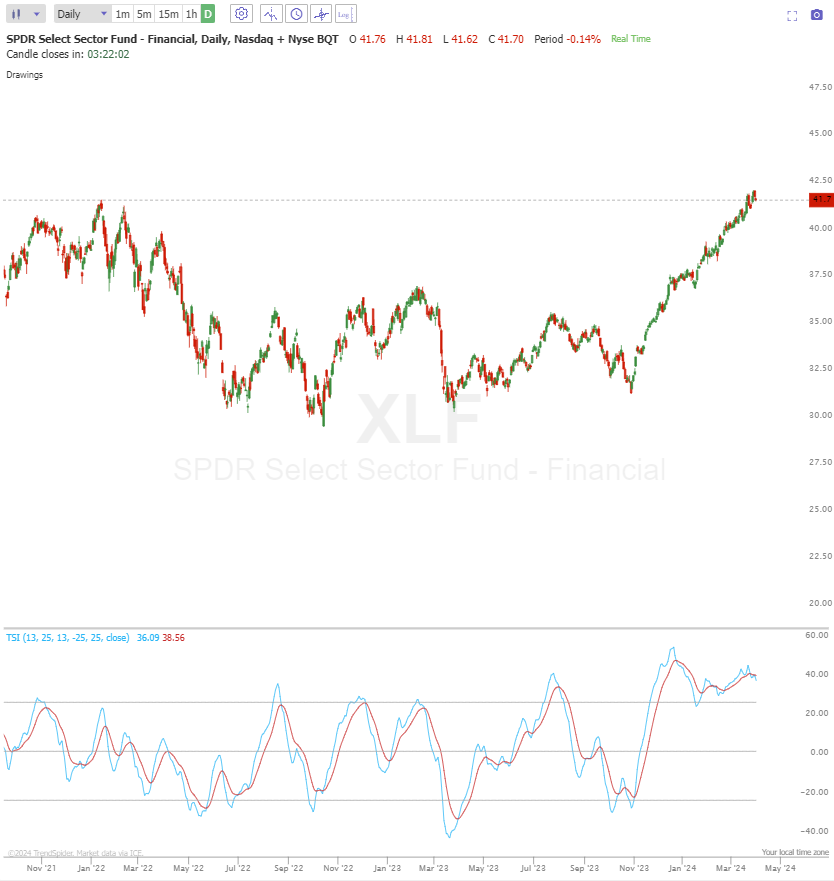
The True Strength Index (TSI) is a momentum oscillator that helps identify trend direction and reversals. It combines price momentum with the direction of the price movement and is smoothed to filter out market noise. The TSI is calculated by taking the double-smoothed price change's ratio to the double-smoothed absolute price change. This indicator is valuable for spotting overbought and oversold conditions and can signal bullish and bearish trends based on its level relative to a centerline (zero).
Input Parameters:
- Fast: Short-term smoothing period: typically around 13
- Slow: Longer term smoothing period: typically around 25
- Signal: The 13-period moving average of TSI, used to generate signals
Use Case:
- Trend Identification: When the TSI crosses above the zero line, it indicates a potential shift to a bullish trend. Conversely, a cross below the zero line may suggest a bearish trend.
- Signal Line Crossovers: Buy signals can be identified when the TSI crosses above its signal line, and sell signals when it crosses below.
- Overbought/Oversold Conditions: Extreme values on the TSI can indicate overbought (above 25) or oversold (below -25) conditions, potentially signaling a reversal.
- Divergences: Divergences between the TSI and price action can indicate weakening momentum and potential reversals. For example, if the price makes a new high but the TSI fails to do the same, it could suggest the uptrend is losing strength.
Do you want to learn more? Check out our Learning Center Article.
What went wrong? (Optional)