
Description:
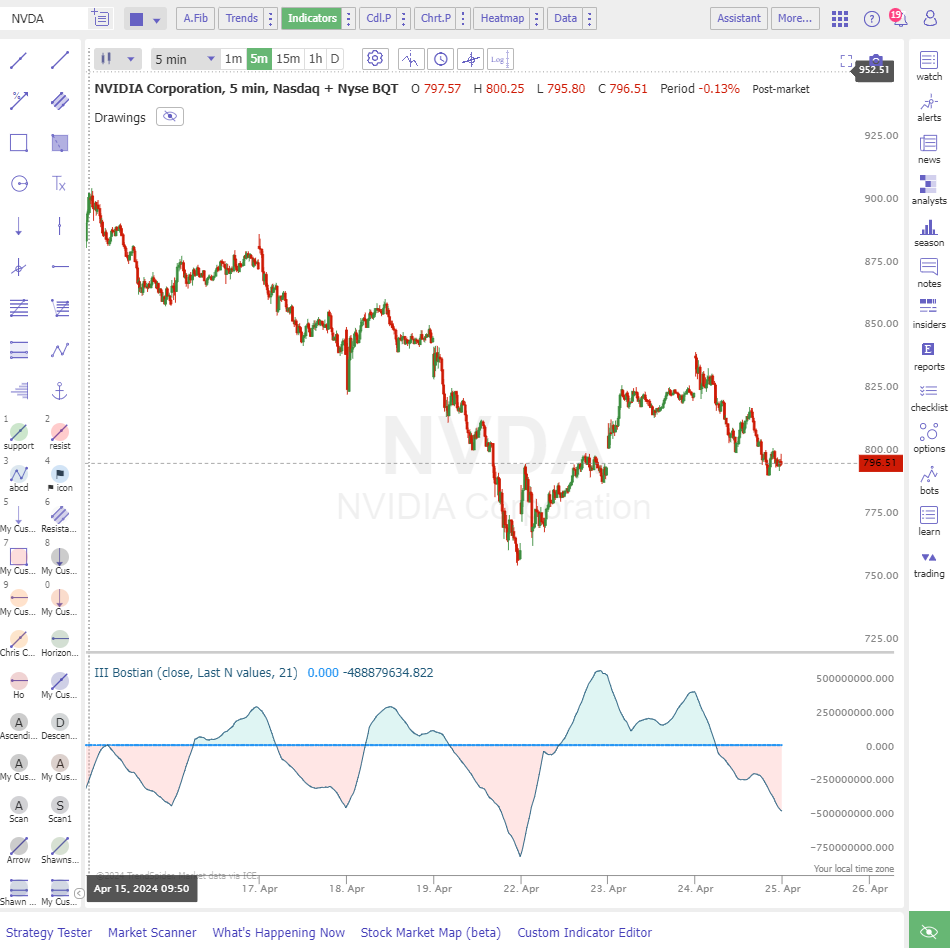
The Intraday Intensity Index, developed by David Bostian, is a volume-based technical indicator that helps gauge the flow of funds for a given stock relative to its price movement. It compares the closing price to the range (high-low) of a session, multiplied by volume, to assess buying or selling pressure. This index often closes near the day's high with positive values indicating strong buying pressure, and negative values near the day's low suggesting strong selling pressure. To conclude, this index is valuable for traders focusing on intraday movements, providing insights into volume dynamics and potential shifts in market control.
Input Parameters:
- Price Source: The specific data points (such as open, high, low, or close) from each candle in a financial chart that an indicator uses for mathematical computations, enabling the calculation of metrics like the average over a specified period.
- Accumulate: Can select no, all, or last N values which determines what data will be used in the calculation of the indicator value.
- Length: Number of periods used in the calculation, only used if select ‘last N values’ from the Accumulate setting.
Use Cases:
- Market Sentiment Analysis: Use the Intraday Intensity Index to understand the underlying market sentiment, particularly whether buyers or sellers are dominating the session.
- Confirming Trends: The index can confirm whether the volume supports the current price trend, with rising values supporting an uptrend and declining values indicating weakness in a downtrend.
- Identifying Reversals: Significant shifts from positive to negative values (or vice versa) can signal potential market reversals.
This feature can be used in:
- Market Scanner
- Strategy Tester
- Multi-Factor Alerts
- Smart Checklist
Do you want to learn more? Check out our Learning Center Article.
What went wrong? (Optional)